
Elasticsearch: from Concepts to Actual Deployment
In a project in recent months, I was responsible for investigating Elasticsearch and constructing a cluster for a product retrieval system. At this moment, the project is almost complete. So I record some of the key technical points for review. In this article, I will briefly introduce some of the basic concepts, the high availability mechanism of Elasticsearch, and then I will talk about some of the problems in actual cluster deployment.
This article is entirely technical, anything related to commercial information has been excluded.
The ELK Stack
I’d like to focus the topic on Elasticsearch, but we just can not ignore the fact that the Elasticsearch often comes along with his two little brothers, they made up the famous ELK stack.
What is ELK?
The “ELK” represents three open source projects: Elasticsearch, Logstash, and Kibana.
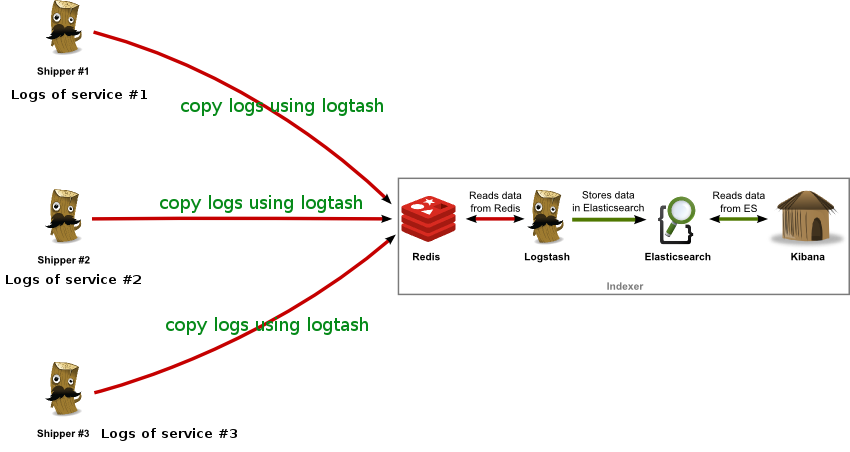
As shown in this picture, Logstash is a data processing pipeline that ingests data from multiple sources simultaneously. It contains two parts: one is the shipper, which is installed at every endpoint and responsible for collecting the logs and putting them into a message queue (e.g. Redis in the picture); the other part is the indexer, which reads data from Redis, processes and transforms it, and then sends it to a “stash” like Elasticsearch. Elasticsearch is a storage and a search engine. Kibana lets users visualize data with charts and graphs in Elasticsearch.
What is it used for?
Briefly speaking, it could provide a centralized management for the distributed log data. Generally in the microservice architecture, the logs distribute at different services, they are hard to be collected and analized. To solve this problem, the ELK stack provides the functionalities such as:
- System monitoring
- Event management
- Fault detection
- Crystal report
- Security analysis
- User behavior analysis etc.
In this article, I’m not going to go into details about ELK, so if you are interested in it, please check the offical document: https://www.elastic.co/elk-stack [1]
Elasticsearch Basics
Elasticsearch is a highly scalable open-source full-text search and analytics engine. It allows you to store, search, and analyze big volumes of data quickly and in near real time. Its key attributes are:
- developed in Java
- based on Lucene, full-text searching
- distributed, multiple nodes
- near real time, the latency is usually less than 1 second
- scalable, can be extended to hundreds of nodes
Interacting with Elasticsearch
Java API
The Java client communicates with Elasticsearch in port 9300 through TCP protocol. The nodes in a ES cluster communicate with each other also through port 9300. There are two kinds of clients:
- Node Client: It joins the cluster as a non-data node. It doesn’t store data, but it knows the place of the requested data and forwards the requests to the right nodes.
- Transport Client: It does not join the cluster, but simply gets one or more initial transport addresses and communicates with them in round robin fashion on each action.
HTTP RESTful API
Other languages could communicate with Elasticsearch in port 9200 through HTTP protocol.
Indexing and Searching
The data structure in Elasticsearch is different from that in a relational database. The index, type, id in ES correspond to schema, table, record in a relational DB, respectively.
- _index –> schema
- _type –> table
- _id –> record
Elasticsearch has an interesting attribute - schemaless, dynamic mapping: If no mapping is specified, Elasticsearch infers field type primitives based upon the first value it sees for that field.
It is so convenient that we no longer need to specify the types for every field. But sometimes if we are not careful, it may cause trouble. For example, when we import the data into our ES cluster, if the first value is 2017-12-25, this field would be infered as date type, then if 0000-00-00 is written to this field, the ES will report invalid date format error. Actually, we don’t want this field to be a date field, just string is OK. Thus we need to turn off the date auto-detection:
curl -XPOST ‘host:port/my_index/_mapping/my_type’ -d ‘{“date_detection”:false}’
Create or Update Examples
The API is:
PUT host:9200/index/type/id -d {“field1” : “value1”, “field2” : “value2”}
example:
curl -XPUT ‘host:9200/my_index/my_type/400?pretty’ -d ‘{“name”: “Emanuele Daddi”}’
returns:
{
    "_index" : "my_index",
    "_type" : "my_type",
    "_id" : "400",
    "_version" : 1,
    "result" : "created",
    "_shards" : {
        "total" : 2,
        "successful" : 1,
        "failed" : 0
    },
    "created" : true
}
Then we do it again:
curl -XPUT ‘host:9200/my_index/my_type/400?pretty’ -d ‘{“name”: “Emanuele Daddi2”}’
It returns:
{
    "_index" : "my_index",
    "_type" : "my_type",
    "_id" : "400",
    "_version" : 2,
    "result" : "updated",
    "_shards" : {
        "total" : 2,
        "successful" : 1,
        "failed" : 0
    },
    "created" : false
}
The _version ensures that the new data will never be overwritten by old data when the data synchronization happens between the nodes in a cluster.
Delete Examples
curl -XDELETE ‘host:9200/my_index/my_type/400?pretty’
It returns:
{
    "found" : true,
    "_index" : "my_index",
    "_type" : "my_type",
    "_id" : "400",
    "_version" : 3,
    "result" : "deleted",
    "_shards" : {
        "total" : 2,
        "successful" : 1,
        "failed" : 0
    }
}
Delete operation will increase the _version number, and if we write this record again the _version number will also be increased.
Search Examples
Search by doc id:
http://host:9200/my_index/my_type/20640186?pretty
returns:
{
  "_index" : "my_index",
  "_type" : "my_type",
  "_id" : "20640186",
  "_version" : 17,
  "found" : true,
  "_source" : {
    "channel" : "xxx",
    "xxx_expire" : "2017-06-01",
    "xxx_publish" : "1",
        ......
    }
}
Search by field value:
http://host:9200/my_index/my_type/_search?q=xxx_field:yyy&pretty
Return all fields with all values:
http://host:9200/my_index/my_type/_search?q=*:*&pretty
The q syntax supports full-text searching.
More Query DSLs: For more complicated Query DSL, please check the offical document: https://www.elastic.co/guide/index.html [2]
List all the indices
curl ‘host:9200/_cat/indices?v’
It returns:
| health | status | index | uuid | pri | rep | docs.count | docs.deleted |
|---|---|---|---|---|---|---|---|
| yellow | open | my_index | izls… | 5 | 1 | 387 | 15 |
pri: primary shard. rep: replica shard. The health parameter has three status: green, yellow, red, they represent:
- green: all the primary and replica shards are available.
- yellow: all the primary shards are available, there exists unavailable replica shards.
- red: there exists unavailable primary shards.
Elasticsearch Cluster
Basic Concepts
Before talking about the mechanisms of ES Cluster, let’s walk through some basic concepts.
cluster: composed of one or more nodes. A node in a cluster will be elected as the master node, the main role of which is to decide which shards to allocate to which nodes, and when to move shards between nodes in order to rebalance the cluster.
node: nodes are the actual instances running in a cluster, they work together, share data and workload. Every node knows the place of a requested data, and could forward the request to the node that hosts the data.
shards: ES could divide an index into many shards, and distributes them to many nodes (shard = HASH(doc_ID) % num_of_pri_shards), this is called shard allocation. Shard allocation is the process of allocating shards to nodes. This can happen during initial recovery, replica allocation, rebalancing, or when nodes are added or removed.
replicas: The replica shards provide data redundancy and ensure the high availability of a cluster. Once the shards in some node are broken, they could be recovered from replica shards. What’s more, replicas also play an important role as load balancer.
The Distributed Index
To better understand how does a distributed index like ES work, l’m going to explain this by the example below.
1.Create Index
Now, we create an index on a single-node cluster, and config it with 3 primary shards and one set of replica shards.
number_of_shards : 3, number_of_replicas : 1

This is a single node cluster, so this node was automatically elected as the master node. The node has three primary shards: P0, P1, P2.
Now if we check the health of the cluster (GET /_cluster/health), we will find the health will be yellow, that is to say all the primary shards are available but there exists unavailable replica shards. Actually we only have one node and ES don’t allow the primary and the replica of the same shard distribute at the same node. Thus the 3 replica shards are in the status of unassigned.
2.Replicas Allocation
For the purpose of availability, nobody will deploy a cluster with only one node in production environment. Now let’s add a second node to the cluster. As long as the cluster.name in the config file of the second node is the same as that of the first node, it will automatically joins the cluster.

After the second node joins the cluster, the three replica shards - R0, R1, R2, are allocated, they correspond to the primary shards P0, P1, P2, respectively. At this moment, even one of the two nodes is broken, we don’t need to worry about losing data. All the newly indexed documents will firstly be stored at primary shards, then they will be copied to the corresponding replica shards. Therefore, the documents could be retrieved on either primary or replica shards. If we check the health of the cluster now, it should be green, which means all the primary and replica shards are available.
3.Horizontal Scaling
We can decrease the workload on each node by adding more nodes. Now let’s start the third node, the cluster thus becomes the three-nodes cluster. In order to rebalance the cluster, the shards will be moved between nodes automatically.
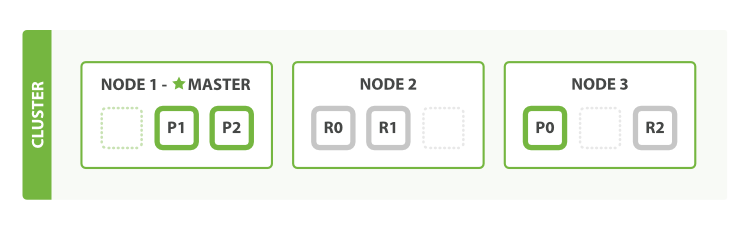
In this picture, P0 of Node 1 and R2 of node 2 are moved to Node 3. Thus each node only contains two shards. That means the resources (CPU, RAM, IO) are shared by less shards, so every shard will get a better performance.
4.Add More Replicas
Now we set two sets of replicas.
“number_of_replicas” : 2 // two sets of replicas
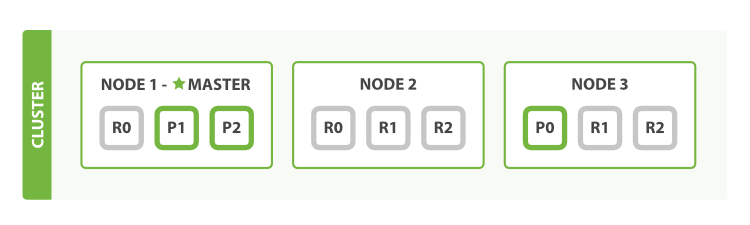
Now this index contains 9 shards in total: 3 primary shards and 6 (two sets of) replica shards. Therefore we gain triple performance improvement.
5.Recover from Disaster
What if one of the three nodes breaks down?

Node 1 was the master node, and it was dead. At this moment, ES will executes the procedures below:
- Elect master node, for example the Node 2 was elected as the master node. Now the health would be red, there exists unavailable primary shards.
- Promote the replicas on Node 2 (R2) and Node 3 (R1) as the primary shards. This step will be done in a blink of eye, thus the
healthwill turn yellow again. - If Node 2 was killed after step 2, the R2 on Node 3 will be promoted as primary shard P2.
- If we restart Node 1 after step 2, the cluster will re-allocates the losing shards (the
healthwill turn green), and copies the newly written data during the failure.
Performance Optimization
Every node in ES cluster could serve the requests, based on the equation shard = HASH(doc_ID) % num_of_pri_shards, node knows where the requested data lives, and forwards the request to that node. In order to improve the searching preformance, some of the methods should be adopted when deploying a cluster.
Deployment of Nodes
1.There are two important parameters in ES configuration file, they are: node.master and node.data. Combine them like this:
(1) node.master: false and node.data: true: makes the node become a data node, which only used for store and retrieve data, thus decreases its resource consumption.
(2) node.master: true and node.data: false: makes the node become a master node, which doesn’t store any data. This node will use its full resources to manage the whole cluster and coordinate various requests and forward the requests to the right data nodes.
(3) node.master: false and node.data: false: this node will become neither master node nor data node. It is used as a load balancer.

2.Turn off the http accessibility in data node: http.enabled: false, which ensures that the data nodes only perform the CRUD operations with its limited resources.
3.Only deploy one node on one server machine.
Data Structure Optimization
1.The number of shards should be as less as possible. If the shards are too many, it will increase the time complexity when the Lucene engine merge the results from all the shards.
2.Unnecessary fields should be eliminated from ES index. This will save the storage space and also improves the searching performance.
The Possibility of Joining Query
The offical document gives three methods for joining query: (1).parent-child relationship. (2).denormalizing your data. (3).application-side joins.
parent-child relationship:
Specify who is the parent type in the child type, and this must be done at index creation time. Then when creating the child type, the id of the parent document must be specified. The parent documents and her children must be stored at the same shard. So when changing the parent of a child type, only updating the parent id in a child type is not enough, because of shard = HASH(doc_ID) % num_of_pri_shards, the new parent may be stored on a different shard. Instead, we should delete the old child document and rebuilt the parent-child relationship.
Drawbacks:
- A lot of feedbacks said that the parent-child way brings low performance.
- The parent-child relationship must be specified at index creation time, which is lack of flexibility and hard to face complex queries.
denormalizing your data (at index time):
Having redundant copies of data in each document that requires access to it removes the need for joins. Because each document contains all of the information that is required to determine whether it matches the query, there is no need for expensive joins.
application-side joins:
This method needs to run multiple queries. For example, get all documents’ ids based on certain conditions in the first query; Then use these ids to query other type(or index) in the second query.
The main advantage of application-side joins is that the data is normalized. The disadvantage is that you have to run extra queries in order to join documents at search time. This approach is suitable when the first entity has a small number of documents and, preferably, they seldom change. This would allow the application to cache the results and avoid running the first query often.
Actual Cluster Deployment
Basic Configuration
The important configuration items in the config/elasticsearch.yml file are shown below:
cluster.name: xxx-cluster     ## all the nodes should have the same cluster.name
node.name: xxx-node1
node.master: true(or false)
node.data: false(or true)
http.enabled: true(or false)
index.number_of_shards: 5     ## default number of shards
index.number_of_replicas: 1   ## default copies of replicas
network.host: local ip
http.port: 9200
transport.tcp.port:9300
discovery.zen.ping.multicast.enabled: false   ## disable multicast
discovery.zen.ping.unicast.hosts: ["master00.ip", "master01.ip"]  ## ips of master nodes, used for auto detection
discovery.zen.minimum_master_nodes: 3  ## The minimum number of master nodes when electing. Preventing "split brain" from occuring. It is usually qeuals to "N/2+1", where N is the total number of master nodes. [3]
discovery.zen.ping.timeout: 5s
bootstrap.memory_lock: true
Then we start all the nodes one by one:
bin/elasticsearch -d
Check the health status:
curl -XGET ‘host:9200/_cluster/health?pretty’
We can also check the health of specific index:
curl -XGET ‘host:9200/_cluster/health/my_index?pretty’
Index and Shards Creating
Set shards when create index:
curl -XPUT ‘host:9200/my_index?pretty’ -d ‘{“number_of_shards”:3,”number_of_replicas”:2}’
List all indices:
curl ‘host:9200/_cat/indices?v’
Mapping Setting
Turn on the date auto-detection:
curl -XPOST ‘host:9200/my_index/_mapping/my_type’ -d ‘{“date_detection”:true}’
Set the date format:
curl -XPOST ‘host:9200/my_index/_mapping/my_type’ -d ‘{“dynamic_date_formats”:”yyyy-MM-dd HH:mm:ss”}’
Turn on digit auto-detection:
curl -XPOST ‘host:9200/my_index/_mapping/my_type’ -d ‘{“numeric_detection”:true}’
Check the mapping of an index:
curl “host:9200/my_index/_mapping?pretty”
Required System Settings
These settings are necessary and must be done, otherwise the ES cluster will encounter problems when it starts running.
1.Set the file handler and the process limits
In /etc/security/limits.conf, append all these commands below to the tail:
work soft nofile 65535
work hard nofile 131072
work soft nproc 2048
work hard nproc 4096
work soft memlock unlimited
work hard memlock unlimited
Take effect on relogin.
2.Set the virtual memory limits
In /etc/sysctl.conf, set vm.max_map_count = 262144.
sudo sysctl -p to make it take effect.
3.Turn off swapping (swapping will dramatically damage the performance)
In linux:
sudo swapoff -a turn off swapping.
swapon -s check swapping status.
In elasticsearch.yml:
bootstrap.memory_lock: true lock the memory.
4.Set the heap volume of JVM
In jvm.options, Set -Xms2g -Xmx2g.
The empirical rules here are:
- Equality: the
Xmsshould be equal to theXmx - Half: the value of
XmsandXmxshould be half of the physical memory.
For example, if your machine has 4GB memory, you should set -Xms2g -Xmx2g for ES node.
Useful Monitoring Commands
The commonly used commands for monitoring a cluster are listed below:
- health of cluster: http://host:9200/_cluster/health?pretty
- list all the nodes: http://host:9200/_cat/nodes?v&h=ip,name,node.role,m,cpu,heap.percent,heap.max,ram.percent,ram.max,disk.used,disk.avail
- list all the index: http://host:9200/_cat/indices?v
- check the shards distribution of an index: http://host:9200/_cat/shards/my_index?v
Slow Log Settings
1.After 5.x.x versions of Elasticsearch, the log settings can not be written in a config file. It can only be set through API, for example:
PUT ip:port/your_index/_settings -d
'{
    "index.search.slowlog.threshold.fetch.warn" : "5s",
    "index.search.slowlog.threshold.fetch.info" : "1s",
    "index.search.slowlog.threshold.fetch.trace" : "500ms",
    "index.search.slowlog.threshold.query.warn" : "5s",
    "index.search.slowlog.threshold.query.info" : "1s",
    "index.search.slowlog.threshold.query.trace" : "500ms",
    "index.search.slowlog.level" : "trace",
    "index.indexing.slowlog.threshold.index.warn" : "5s",
    "index.indexing.slowlog.threshold.index.info" : "1s",
    "index.indexing.slowlog.threshold.index.trace" : "500ms",
    "index.indexing.slowlog.level" : "trace"
}'
The config items are: slow log query, slow log fetch, slow log index. To check your settings:
GET ip:port/your_index/_settings?pretty
2.Each index should be set separately, that is:
PUT ip:port/your_index/_settings …
3.Different nodes will generate different logs, actually the slow log works on the shard level scope.
Add Supervisor Monitoring for ES
1.Firstly, ps -ef | grep supervisor, find and kill the supervisor process, then restart it sudo /usr/bin/python /usr/bin/supervisord -c /etc/supervisord.conf. Please note that the aim of this step is to let supervisor read the newest system settings such as /etc/security/limits.conf, /etc/sysctl.conf introduced before. Otherwise when starting ES by supervisor, it will still report errors.
2.Create a new file called elasticsearch.conf in /etc/supervisor/conf.d directory, and write these lines:
[program:elasticsearch]
environment=JAVA_HOME=/home/work/java-current  ## must be specified otherwise the supervisor can't find the env params
command=/home/work/elasticsearch-5.6.3/bin/elasticsearch
user=work  ## supervisor execute commands with root by default, but ES must be executed with a non-root user.
autostart=true
autorestart=true
startretries=3
stdout_logfile = /etc/supervisor/logs/elasticsearch.log
Then by sudo chmod a+x elasticsearch.conf, to make it executable.
3.execute sudo supervisorctl reload to make it take effect.
4.kill the elasticsearch process, to see if it could restart again by itself.
Install Chinese word segmenter IK
For Chinese users, an extra work is needed. Because the ES doesn’t perform well in Chinese words segmentation, we have to install a plugin to solve this problem.
- firstly, download it: https://github.com/medcl/elasticsearch-analysis-ik/releases [4]
- then unpack it and rename it as
ik, and copy it toelasticsearch/plugins/ - In
plugin-descriptor.properties, edit theelasticsearch.version. - restart ES, and check if it takes effect.
References
[1] What is the ELK Stack: https://www.elastic.co/elk-stack
[2] Elasticsearch offical document: https://www.elastic.co/guide/index.html
[3] How to avoid the split-brain problem: https://blog.trifork.com/2013/10/24/how-to-avoid-the-split-brain-problem-in-elasticsearch/
[4] IK Chinese word segmenter: https://github.com/medcl/elasticsearch-analysis-ik/releases
[5] How to Monitor Your Elasticsearch Cluster Performance: https://stackify.com/monitoring-elasticsearch-getting-right/
[6] How to set up ES cluster: https://stackoverflow.com/questions/16821101/how-to-set-up-es-cluster
[7] How to install multi-node ES cluster on linux: https://tecadmin.net/install-elasticsearch-multi-node-cluster-on-linux/
[8] ElasticSearch Cluster - Configuration & Best Practices: http://www.xmsxmx.com/elasticsearch-cluster-configuration-best-practices/
[9] Elasticsearch Java Virtual Machine settings explained: http://jprante.github.io/2012/11/28/Elasticsearch-Java-Virtual-Machine-settings-explained.html
[10] Highly Available ELK Setup: https://everythingshouldbevirtual.com/highly-available-elk-elasticsearch-logstash-kibana-setup/
[11] Elasticsearch Tutorial: Creating an Elasticsearch Cluster: https://dzone.com/articles/elasticsearch-tutorial-creating-an-elasticsearch-c
